Infographics are the hottest new trend in marketing: Part dynamic graphic and part informational flowchart, infographics are a great way to visually impart information, especially for subjects that typically don’t lend themselves to visuals.
While not new, infographics have in the last couple of years found a home in social media. Because they contain helpful, easily consumable information in a visually entertaining form, they are perfect for social sharing. Take a look around Pinterest, Facebook or G+, and I guarantee you’ll find great examples of this.
Marketers like infographics because they are relatively easy content to create, and address the ongoing shift to visuals in marketing. In fact, articles that include relevant images have been shown to have 94 percent more total views, on average, than articles without images, most likely because, as studies have shown, visuals are processed more easily by the human brain. They also like infographics because they are easily shared — which helps to create buzz — and they promote social engagement, and as a result, improve website search engine optimization. Infographics are a powerful marketing tool!
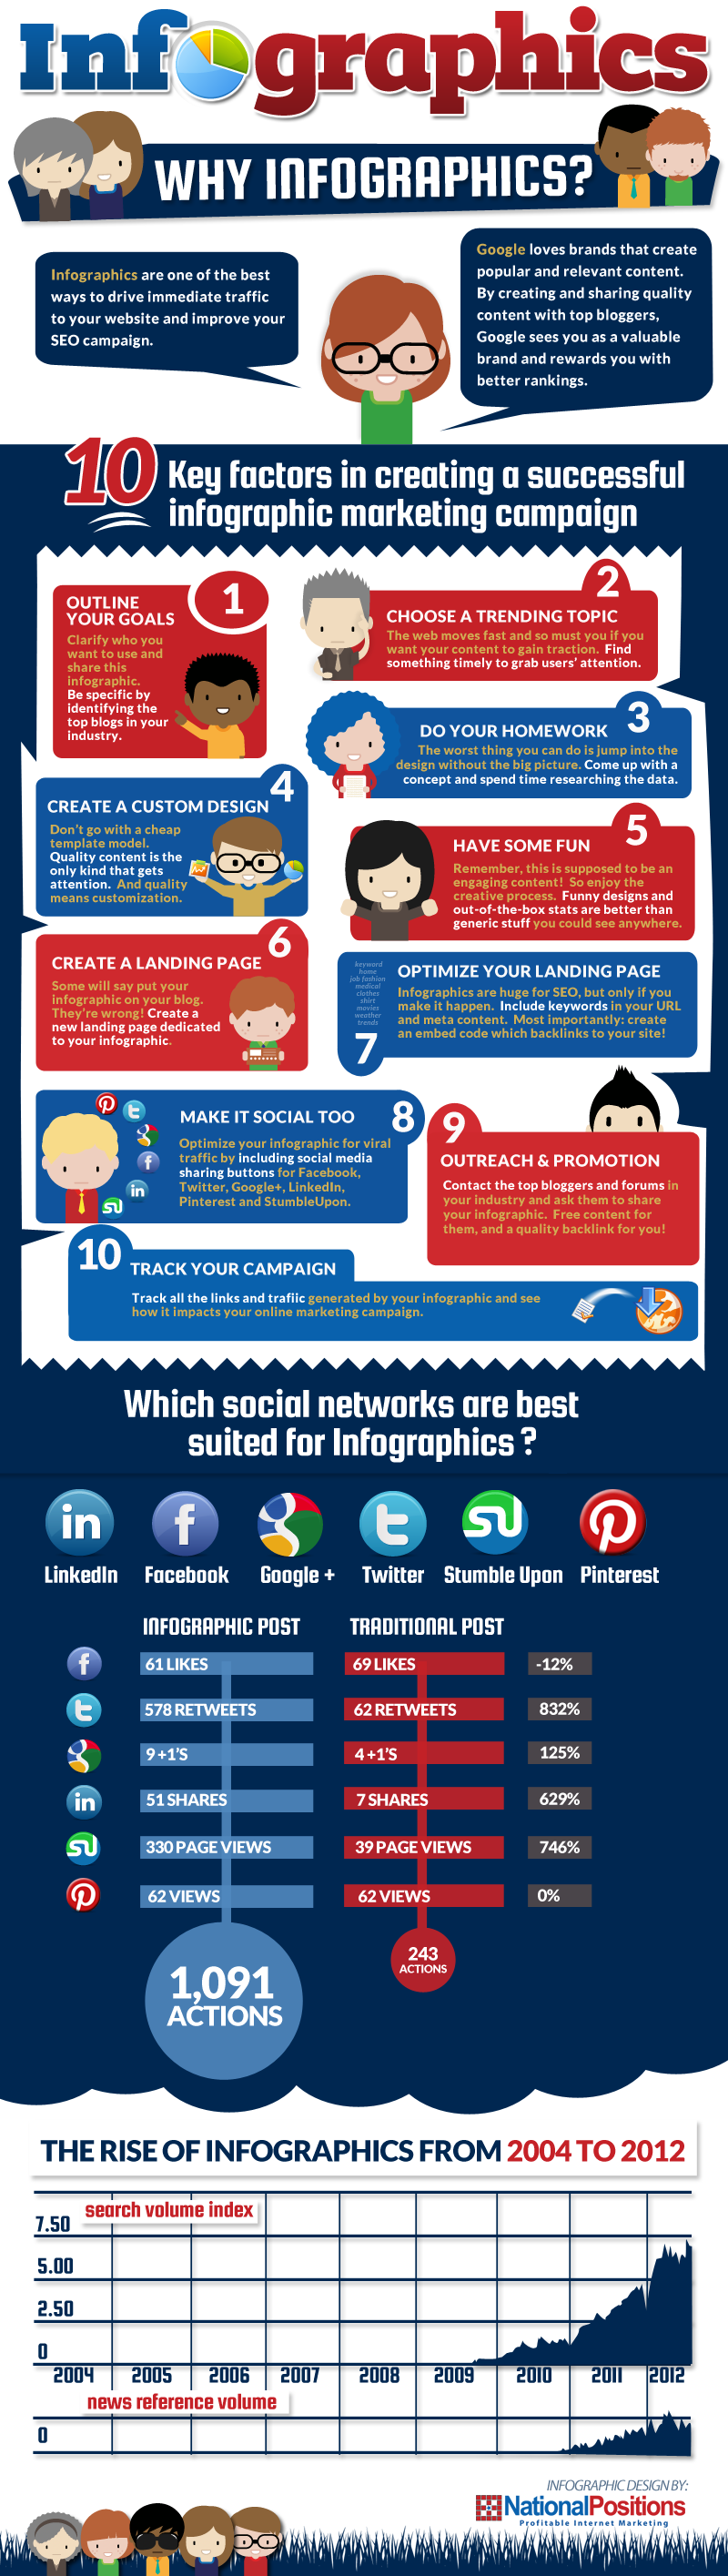
So to tell you a little more about infographics, how to use them and how to get started… well, how about an infographic on infographics?!
With all due credit to NationalPositions, here’s the ultimate guide to get started on using infographics. And if you’d like to see more infographics on many more marketing subjects, please visit our Pinterest page!

![]() Lynn Christiansen Esquer is a principal at SocialProse Media. Email her at lesquer@socialprosemedia.com
Lynn Christiansen Esquer is a principal at SocialProse Media. Email her at lesquer@socialprosemedia.com

Pingback: Show, don’t just tell: how visuals shine a light on your business | SocialProse Media